This summer, low water levels in the Netherlands' rivers have caused widespread concern and prompted much discussion. When I was young, however, high water seemed to be the greater threat.
I vividly remember the flood of 1995, when around 250,000 people had to be evacuated. My school closed for two weeks, and when my room flooded, I had to move upstairs. Despite all that, it felt a little like an extra Christmas holiday.
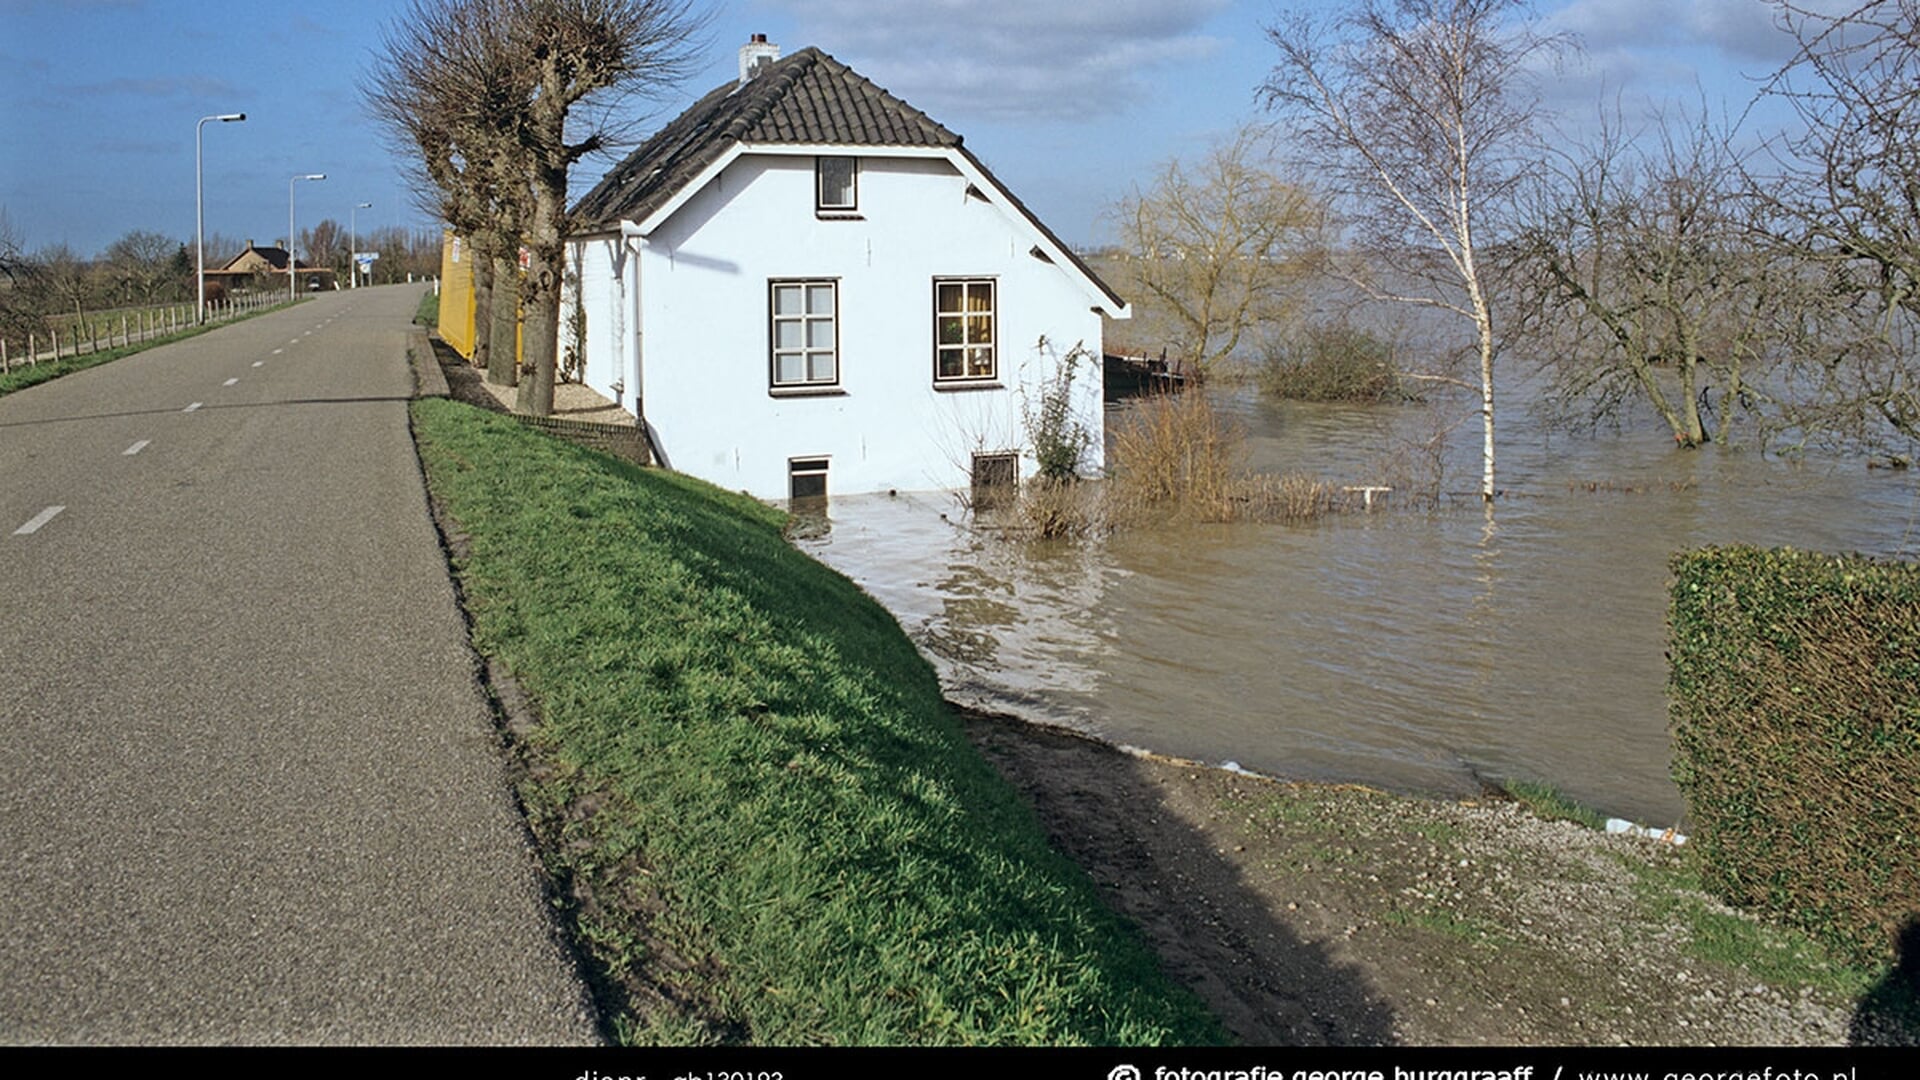
I wanted to know whether my memory corresponded with the historical records. Is high water in the Rhine now less frequent and are lower water levels occurring more often? I downloaded and visualised the data to see if those patterns are really emerging.
Each line below shows one year at Lobith, from January to December. The record begins in 1901. As new years appear, older ones go to the background. At the end, the field rotates to reveal the full landscape over time.